

Jains in Rajasthan - A Study Through Census 2011
Author : Mr. Dheeraj Jain
1. Introduction: Rajasthan, India's largest state by area, always had a close and historical connection with Jainism. There are many famous Jain centres from history that includes Soniji Ki Nasiyan (Ajmer Jain Temple), Bhinmal, Sanganer, Rishabhdeo, Shri Mahaveerji temple, Padampura, Nakoda, Mount Abu, Jirawala, Ranakpur, Bijolia, Chittorgarh, Bhandasar etc.
As per Census 2011, the density of population per sq. km. is 365 which has increased a lot from 315 in 2001. The average household size has also gone down to 4.6 in 2011 from 4.9 in 2001.
2. Population as per Census 2011: Rajasthan has got the second highest number of Jains in the country. The total population of Rajasthan State as per Census 2011 is 68,548,437. Out of this, the population of Jains is 622,023 i.e. 0.91% of the total population of Jains in Rajasthan.
| Religion | Total Population | % | Male | % | Female | % |
| Total | 68,548,437 | 100.00 | 35,550,997 | 51.86 | 32,997,440 | 48.14 |
| Hindu | 60,657,103 | 88.49 | 31,485,832 | 51.91 | 29,171,271 | 48.09 |
| Muslim | 6,215,377 | 9.07 | 3,193,530 | 51.38 | 3,021,847 | 48.62 |
| Christian | 96,430 | 0.14 | 48,887 | 50.70 | 47,543 | 49.30 |
| Sikh | 872,930 | 1.27 | 459,406 | 52.63 | 413,524 | 47.37 |
| Buddhist | 12,185 | 0.02 | 6,382 | 52.38 | 5,803 | 47.62 |
| Jain | 622,023 | 0.91 | 317,614 | 51.06 | 304,409 | 48.94 |
| Other Religions and Persuasions | 4,676 | 0.01 | 2,399 | 51.30 | 2,277 | 48.70 |
| Religion not stated | 67,713 | 0.10 | 36,947 | 54.56 | 30,766 | 45.44 |
The Jains with 0.91% of the total population constitute fourth largest group after Hindu, Muslim and Sikh. In 2001, the number of Jains were 6,50,493.
 |
3. Population of Jains in Rajasthan in last 50 years: During last 50 years i.e. from 1961 onwards, the population of Jains in Rajasthan has been fluctuating. It is evident from the table below:
| Population | 1961 | 1971 | 1981 | 1991 | 2001 | 2011 |
| Total | 4,09,417 | 5,13,548 | 6,24,317 | 5,62,806 | 6,50,493 | 6,22,023 |
| Rural | 2,38,658 | 2,74,978 | 3,15,011 | 2,20,718 | 2,15,172 | 1,66,322 |
| Urban | 1,70,759 | 2,38,570 | 3,09,306 | 3,42,088 | 4,35,321 | 4,55,701 |
| Male | 2,06,671 | 2,55,411 | 3,13,767 | 2,84,148 | 3,31,871 | 3,17,614 |
| Female | 2,02,746 | 2,58,137 | 3,10,550 | 2,78,658 | 3,18,622 | 3,04,409 |
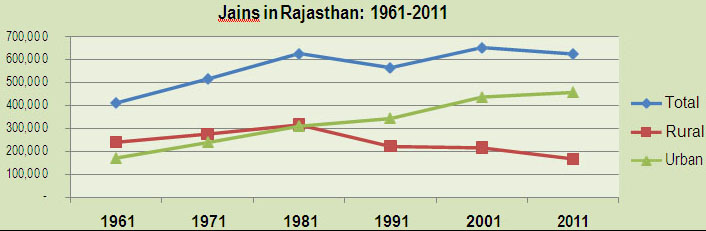 |
The above graph clearly shows the movement of Jains to urban areas of Rajasthan. The proportion of Jains in Urban areas has increased to 73.3% in 2011 from 41.7% in 1961 while in Rural areas, it has gone down to 26.7% in 2011 from 58.3% in 1961.
4. Sex – Ratio: Of the 6,22,023 Jains in Rajasthan, 3,17,614 are males and 3,04,409 are females. The Sex-Ratio (no. of females per 1000 males) is 958, much better than State rate of 928. However, there is slight decline from 2001 wherein it was 960.
| Total | Hindu | Muslim | Christian | Sikh | Buddhist | Jain | |
| Sex-Ratio | 928 | 926 | 946 | 973 | 900 | 909 | 958 |
| Sex-Ratio (0-6) | 888 | 886 | 919 | 891 | 840 | 878 | 859 |
However, the situation is alarming in case of child sex ratio (i.e population of 0-6). It states that 141 girls are lesser compared to per thousand male children of age 0-6. If we see the district-wise figures than 26 districts are at less than 900. The situation is worst in districts of Jhunjhunun (740), Dhaulpur (872) and Karauli (874).
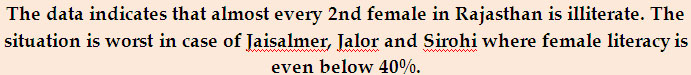
5. Literacy: Jains have the highest literacy rate amongst all communities in Rajasthan. This holds good for male as well as female. If one see the District level data, in all districts except Jalor and Jaisalmer, Jains have literacy rate of more than 90% and it is more than 95% in 18 districts.
| Literacy (2011) | Total | Hindu | Muslim | Christian | Sikh | Buddhist | Jain |
| Total | 66.11 | 66.04 | 62.68 | 80.68 | 70.07 | 75.8 | 95.14 |
| Male | 79.19 | 79.37 | 75.38 | 86.79 | 78.2 | 86.41 | 97.97 |
| Female | 52.12 | 51.77 | 49.35 | 74.47 | 61.12 | 64.2 | 92.21 |
However, if we consider the total population there is a wide gap in literacy level between male and female.
 |
6. Work Participation Rate (WPR): The Census 2011 has provided the following data in terms of the work participation rate (WPR) or percentage of workers to total population.
| WPR (2011) | Total | Hindu | Muslim | Christian | Sikh | Buddhist | Jain |
| Total | 43.6 | 44.33 | 36.89 | 45.26 | 47.97 | 41.21 | 33.68 |
| Male | 51.47 | 51.56 | 49.16 | 52.75 | 58.56 | 49.97 | 56.10 |
| Female | 35.12 | 36.53 | 23.93 | 37.56 | 36.2 | 31.59 | 10.29 |
The WPR is 2nd highest among the Jain males (56.10%) after Sikhs (58.56%). However, the female WPR is at the lowest among Jains (10.29%) despite having highest literacy rate amongst all communities. This indicates that gender gap with respect to WPR is much wider. Apparently, the available talent/skill amongst Jain females are not being utilised in economic activities and they are mostly devoted to performing religious activities or household chores.
7. Occupation: The Census 2011 has also provided the data in terms of four broad work participation categories namely Cultivators, Agricultural Labourers, Household Industry Workers and Other Workers (the last category includes workers in tertiary sector such as service, manufacturing, trade & commerce and allied activities).
| Occupation (%) | Total | Hindu | Muslim | Christian | Sikh | Buddhist | Jain |
| Cultivators | 45.57 | 47.30 | 31.09 | 28.29 | 37.09 | 34.65 | 3.14 |
| Agricultural Labourers | 16.53 | 16.82 | 12.90 | 10.86 | 25.83 | 17.62 | 1.18 |
| Household Industry | 2.41 | 2.23 | 4.45 | 1.60 | 1.36 | 1.83 | 5.85 |
| Others | 35.49 | 33.65 | 51.55 | 59.26 | 35.72 | 45.90 | 89.83 |
(The main and marginal worker have been added to have a broad picture of occupation)
In Rajasthan, only 3.14% of Jain population were engaged as cultivators, 1.18% as Agricultural labourers, and 5.85% as household industry workers. The majority of Jains are mainly in Others (89.83%), highest amongst all religious communities. This reinforces the trader/business characteristics of Jain community.
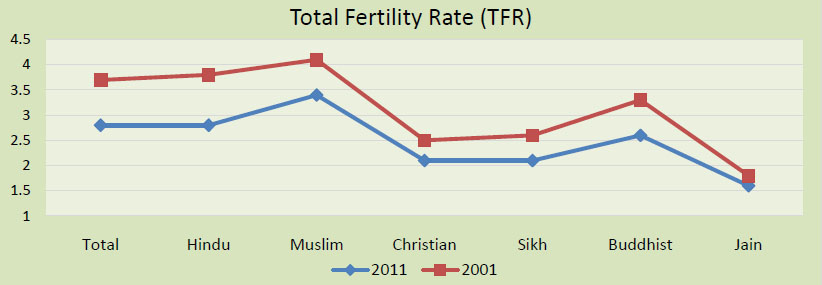
8. Fertility: Total Fertility Rate (TFR) is lowest amongst Jains at the rate of 1.6. It indicates that Jains are having less number of children.
| Total | Hindu | Muslim | Christian | Sikh | Buddhist | Jain | |
| 2011 | 2.8 | 2.8 | 3.4 | 2.1 | 2.1 | 2.6 | 1.6 |
| 2001 | 3.7 | 3.8 | 4.1 | 2.5 | 2.6 | 3.3 | 1.8 |
 |
9. Age-group wise distribution of population: An attempt has been made to compare the population of Jains with other communities in broader age group. Census 2011 gives the following data in terms of proportion of population:
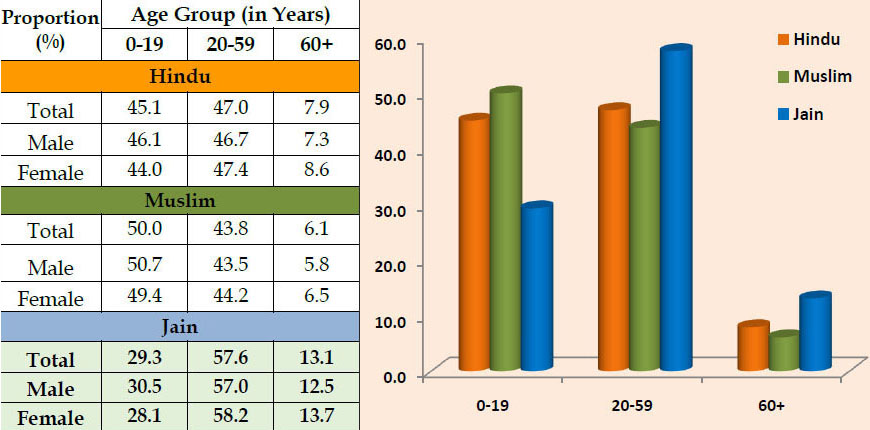 |
In contrast to other communities, Jains have the lowest population in the age group of 0-19 while maximum in the age group of 60+. On a positive note, we may say that Jains have the more longevity of life as compared to others due to Jain way of life. However, the current population in 20-59 age-group will be 60+ in a phased manner and as there are less numbers of Jains in younger age group, Jains will have more aged population to support vis-à-vis other communities.
10. Age at marriage: Census 2011 shows that Child marriage is still in practice in Rajasthan among Jains. Out of the 1,78,533 ever married males, 2.5% Male were less than 15 years of age. However, in case of female, the percentage is quite higher at 10.8% for female and it goes up to 12.6% in Rural areas. This is contrary to the high literacy rate amongst Jains. As the data is available only at State level, creating awareness may be the best solution to eradicate this problem.
11. District-wise Analysis: As per Census 2011, there are 33 districts in Rajasthan. The distribution of Jains population in a decreasing order in these districts is as under:
| Sl. No. | State/District | 2011 | 2001 | Decadal Growth Rate | ||||
| Total | Male | Female | Total | Male | Female | |||
| Rajasthan | 6,22,023 | 3,17,614 | 3,04,409 | 6,50,493 | 3,31,871 | 3,18,622 | -4.38 | |
| 1 | Jaipur | 81,079 | 41,785 | 39,294 | 73,631 | 38,491 | 35,140 | 10.12 |
| 2 | Udaipur | 78,647 | 40,221 | 38,426 | 83,699 | 42,716 | 40,983 | -6.04 |
| 3 | Ajmer | 45,614 | 23,231 | 22,383 | 47,812 | 24,498 | 23,314 | -4.60 |
| 4 | Jodhpur | 36,697 | 18,555 | 18,142 | 36,694 | 18,718 | 17,976 | 0.01 |
| 5 | Bhilwara | 35,149 | 17,775 | 17,374 | 37,659 | 19,230 | 18,429 | -6.67 |
| 6 | Barmer | 34,010 | 17,453 | 16,557 | 35,744 | 18,253 | 17,491 | -4.85 |
| 7 | Bikaner | 30,850 | 15,500 | 15,350 | 31,235 | 15,711 | 15,524 | -1.23 |
| 8 | Chittaurgarh | 25,843 | 13,139 | 12,704 | 35,026 | 17,949 | 17,077 | -26.22 |
| 9 | Kota | 25,742 | 13,396 | 12,346 | 23,259 | 12,183 | 11,076 | 10.68 |
| 10 | Banswara | 22,613 | 11,579 | 11,034 | 18,406 | 9,448 | 8,958 | 22.86 |
| 11 | Tonk | 22,458 | 11,420 | 11,038 | 23,644 | 12,144 | 11,500 | -5.02 |
| 12 | Pali | 18,974 | 9,550 | 9,424 | 25,599 | 12,808 | 12,791 | -25.88 |
| 13 | Dungarpur | 16,141 | 8,303 | 7,838 | 12,542 | 6,350 | 6,192 | 28.70 |
| 14 | Rajsamand | 14,966 | 7,413 | 7,553 | 20,048 | 9,905 | 10,143 | -25.35 |
| 15 | Jalor | 14,640 | 7,251 | 7,389 | 21,015 | 9,753 | 11,262 | -30.34 |
| 16 | Pratapgarh* | 14,077 | 7,064 | 7,013 | - | - | - | - |
| 17 | Bundi | 13,455 | 7,018 | 6,437 | 13,186 | 6,916 | 6,270 | 2.04 |
| 18 | Alwar | 13,221 | 6,906 | 6,315 | 12,859 | 6,747 | 6,112 | 2.82 |
| 19 | Nagaur | 12,940 | 6,594 | 6,346 | 17,478 | 8,942 | 8,536 | -25.96 |
| 20 | Jhalawar | 12,488 | 6,438 | 6,050 | 11,759 | 6,136 | 5,623 | 6.20 |
| 21 | Sawai Madhopur | 9,991 | 5,246 | 4,745 | 10,660 | 5,614 | 5,046 | -6.28 |
| 22 | Churu | 7,104 | 3,562 | 3,542 | 13,882 | 6,672 | 7,210 | -48.83 |
| 23 | Sirohi | 6,829 | 3,331 | 3,498 | 12,427 | 5,891 | 6,536 | -45.05 |
| 24 | Bharatpur | 5,758 | 2,983 | 2,775 | 6,760 | 3,540 | 3,220 | -14.82 |
| 25 | Sikar | 4,050 | 2,037 | 2,013 | 4,957 | 2,470 | 2,487 | -18.30 |
| 26 | Dausa | 3,737 | 1,968 | 1,769 | 3,908 | 2,081 | 1,827 | -4.38 |
| 27 | Karauli | 3,424 | 1,827 | 1,597 | 3,760 | 1,951 | 1,809 | -8.94 |
| 28 | Baran | 2,795 | 1,466 | 1,329 | 2,687 | 1,420 | 1,267 | 4.02 |
| 29 | Dhaulpur | 2,739 | 1,463 | 1,276 | 2,685 | 1,414 | 1,271 | 2.01 |
| 30 | Ganganagar | 1,988 | 1,041 | 947 | 2,696 | 1,415 | 1,281 | -26.26 |
| 31 | Hanumangarh | 1,935 | 993 | 942 | 2,623 | 1,356 | 1,267 | -26.23 |
| 32 | Jaisalmer | 1,521 | 791 | 730 | 1,670 | 896 | 774 | -8.92 |
| 33 | Jhunjhunun | 548 | 315 | 233 | 483 | 253 | 230 | 13.46 |
 |
Rajasthan has got a negative growth rate and population of Jains have decreased by substantive number of 28,470 though the State is considered to be a stronghold of Jains.
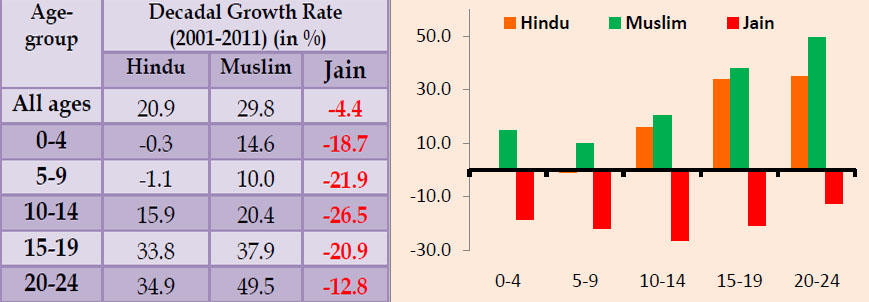
12. Negative growth in young population: The data on population by age group is vital as it unveils the characteristics of population composition and provides some insight about the future growth. A worrisome finding of Census 2011 is that growth rate in Jains among 0-24 year age group is negative. In this age group, Census 2011 has recorded 2,38,049 Jains, against 2,98,305 in 2001. This means a decline of 60,256 Jains i.e. a decadal growth rate of -20.2%. This is not a good sign.
 |
13. A steep decline in number of future/prospective parents: A disturbing trend revealed by Census 2011 data is more than 20% decrease in the male and female population of age group 0-24 years in Rajasthan.
| Age-Group | Male | Female | ||||||
| 2011 | 2001 | Difference | % | 2011 | 2001 | Difference | % | |
| 0-4 | 20,914 | 25,648 | -4,734 | -18.5 | 18,121 | 22,386 | -4,265 | -19.05 |
| 5-9 | 23,156 | 29,217 | -6,061 | -20.7 | 20,099 | 26,150 | -6,051 | -23.14 |
| 10-14 | 25,319 | 33,600 | -8,281 | -24.6 | 22,458 | 31,359 | -8,901 | -28.38 |
| 15-19 | 27,603 | 33,379 | -5,776 | -17.3 | 24,771 | 32,813 | -8,042 | -24.51 |
| 0-24 | 27,809 | 33,488 | -5,679 | -17.0 | 27,799 | 30,265 | -2,466 | -8.15 |
| Total | 124,801 | 155,332 | -30,531 | -19.7 | 113,248 | 142,973 | -29,725 | -20.8 |
It is clearly evident from the above that population of Jains have declined in the crucial age group. The young population is decreasing and is not replaced by equal/more numbers. This would result in having more aged persons and lesser young people to support them.
Further, Jains in Rajasthan have the fertility rate of 1.6, lowest amongst all communities. All over the world, a TFR of 2.1 is considered to be ideal for replacement of equal number of population. With less number of daughters/sons and lowest fertility, a proper population growth prospects are unlikely. All these factors may have adverse implications on Jain population, though these might be visible only after 20-30 years.
14. Way ahead: Creating awareness in the Jain community is the first and foremost requirement. With the availability of data at District/Tehsil level, the vulnerable areas may be identified and suitable action may be taken. The efforts must include the target of achieving cent percent literacy, improving the sex-ratio, creating awareness amongst young Jains about the Jain philosophy and doctrines based on facts, logic, scientific research using modern AV and social media etc.
-----------------------------------------------------
Author : Mr. Dheeraj Jain
E-Mail : djain.rgi@gmail.com
-----------------------------------------------------
Mail to : Ahimsa Foundation
www.jainsamaj.org
R260618
